· marketing · 7 min read
Pardot's Reporting: Are You Missing Key Insights? Top Tips to Optimize Your Analysis
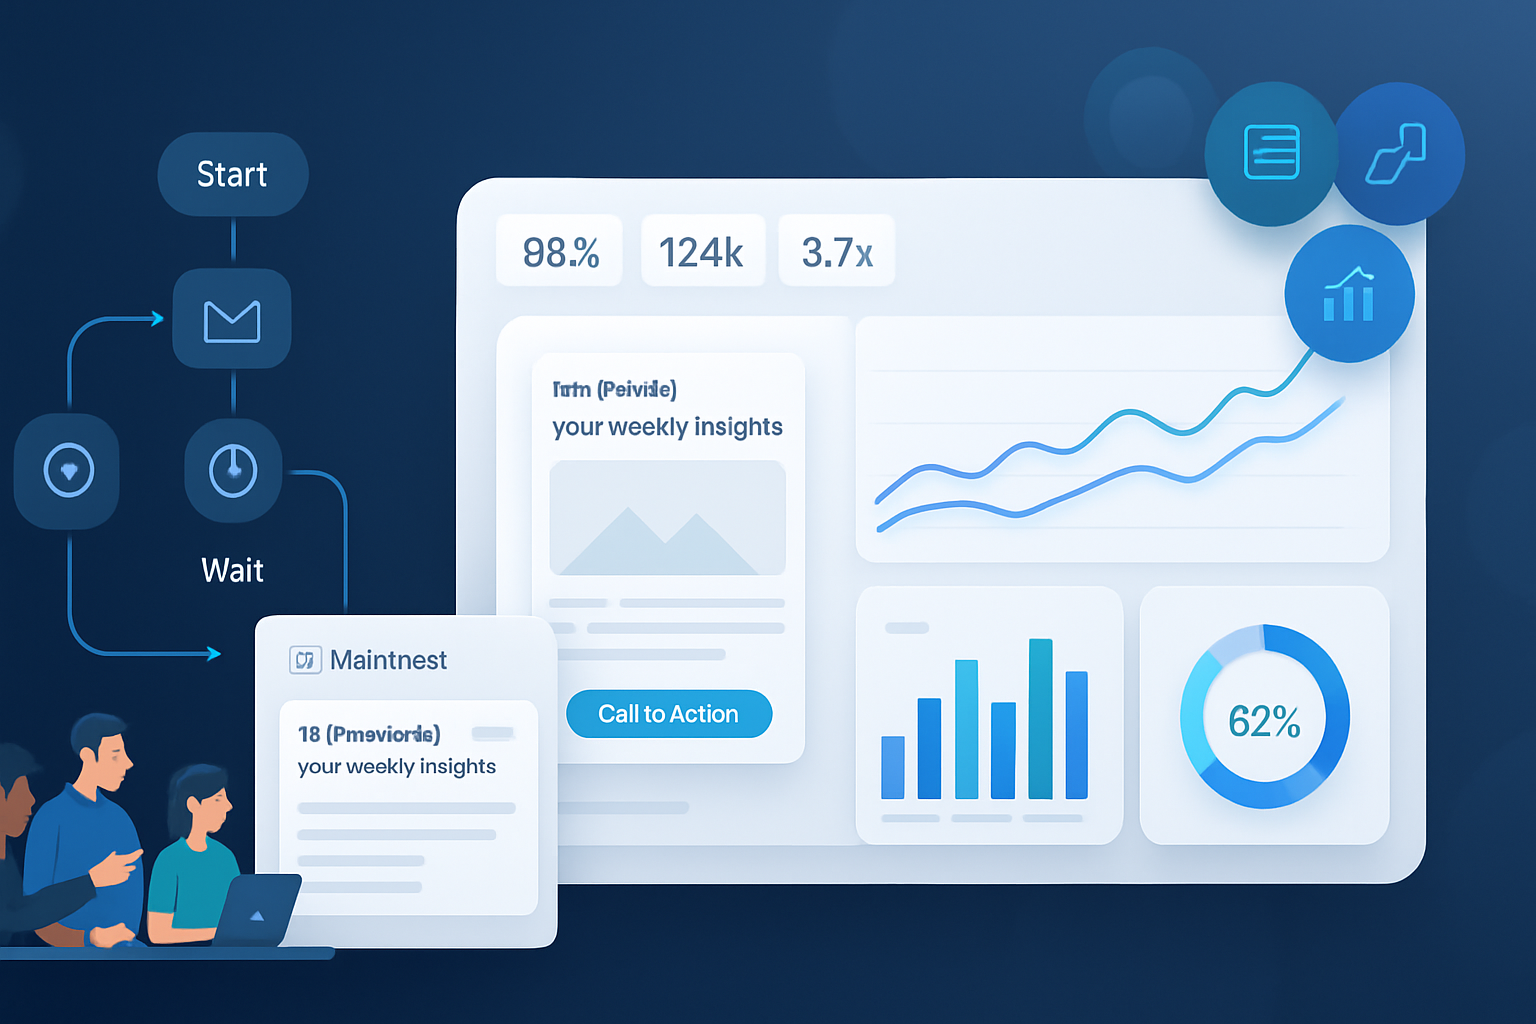
Unlock actionable insights from Pardot by fixing tracking gaps, standardizing naming, leveraging Salesforce connections, and using the right reports and dashboards. This guide gives practical steps and templates to ensure you're not missing key marketing intelligence.

Introduction - what you’ll get from this article
Imagine being able to answer, in under a minute, which campaign actually moved the needle this quarter. Clear. Actionable. Trusted. That’s what better Pardot reporting delivers.
Read on and you’ll learn concrete, step-by-step ways to extract cleaner data, build the reports that matter, and interpret output so your next marketing decision is smart - not guesswork.
Why Pardot reporting matters (and why it often underdelivers)
Pardot (Salesforce Marketing Cloud Account Engagement) captures rich prospect and campaign data. But raw data isn’t insight. Too often marketers face: incomplete tracking, inconsistent naming, disconnected Salesforce campaigns, and vague KPIs. The result: dashboards that look pretty but don’t tell you what to do.
Fix those core problems and Pardot goes from a data silo to the engine that informs strategy.
Key metrics to track (and how to interpret them)
- Prospects created - early-funnel demand. Watch trends and sources.
- MQLs / SQLs (if mapped) - quality gating - pairs best with Salesforce opportunity data.
- Email metrics - delivered, open rate, click-through rate (CTR), click-to-open (CTOR), bounce rate.
- Form conversions / form conversion rate - landing-page effectiveness.
- Landing page visits and CTA conversion - top-of-funnel engagement.
- Opportunity influence & revenue - bottom-line impact (requires Salesforce link).
- Engagement Score and grading - prospect fit and interest.
Interpretation tips
- High opens, low clicks - content or CTA problem. Test CTAs, preheaders, and above-the-fold offers.
- High clicks, low conversions - landing page or form friction. Reduce fields, test flows.
- Campaigns with many prospects but no pipeline - audience mismatch. Reassess targeting.
Tip 1 - Ensure tracking is bulletproof
Why it matters: Without reliable tracking you can’t trust any report.
Steps:
- Confirm the Pardot tracking code (JavaScript tracker) is installed site-wide, including Subdomains. Don’t rely only on tag managers for critical pages.
- Use UTM parameters consistently for paid and external campaigns. Create a naming standard (example below).
- Create and use Pardot Custom Redirects for external links and PDF downloads so clicks are captured as prospects’ activity.
- Verify forms and landing pages have completion actions and that redirects are measured.
Naming convention example (copy/paste):
utm_source=channel&utm_medium=campaign_type&utm_campaign=campaign_name&utm_content=creative_id

Example: utm_source=linkedin&utm_medium=paidsocial&utm_campaign=q3-enterprise-launch&utm_content=cta-blue-1
Tip 2 - Standardize campaigns, tags, and naming conventions
Why it matters: If you can’t reliably group assets, you’ll undercount or double-count activity.
Action checklist:
- Decide a single Campaign model (Pardot campaigns vs. Salesforce campaigns) and map it to your GTM strategy.
- Use a campaign naming schema and enforce it across paid, organic, events, and emails.
- Tag assets (emails, landing pages, forms, content) with campaign IDs or a consistent prefix.
- Document the rules in a living Playbook and train the team.
Tip 3 - Connect Pardot to Salesforce properly (and use the data)
Why it matters: Revenue attribution lives in Salesforce. Pardot captures engagement; Salesforce shows deals.
Must-dos:
- Confirm the Pardot connector is configured and syncing prospects to contacts/leads reliably.
- Link Pardot campaigns to Salesforce campaigns. Use the Connected Campaigns feature to sync campaign membership and influence data.
- Leverage Campaign Influence and Opportunity Contact Role data in Salesforce to measure impact.
- Create cross-object reports in Salesforce (Campaigns → Opportunities) to attribute revenue.
Reference: Salesforce docs on connecting Pardot and Salesforce: https://help.salesforce.com/s/articleView?id=sf.pardot_connectors_overview.htm
Tip 4 - Use the right Pardot reports, and know their limits
Pardot native reports are valuable but have constraints. Know which to use and when to escalate to B2B Marketing Analytics (B2BMA) or exports.
Useful Pardot reports:
- Email Report - opens, clicks, bounces, unsubscribes, recipient engagement.
- Landing Page & Form Reports - views, submissions, conversion rates.
- Custom Redirect Reports - click tracking for assets and CTAs.
- Engagement Studio Reports - step-level performance for nurture programs.
- Prospect Activity - timeline and aggregate activity for individual leads.
Limits:
- Pardot reporting is prospect-centric and can miss multi-touch revenue attribution details.
- Time-zone and reporting window differences can cause mismatches with Salesforce.
When to use B2B Marketing Analytics (Einstein Analytics)
If you need multi-touch attribution modeling, custom dashboards with cross-object joins (prospect → campaign → opportunity), or large dataset joins, B2BMA (or exporting data to a BI tool) is the right next step.
Reference: B2B Marketing Analytics overview: https://help.salesforce.com/s/articleView?id=sf.pardot_b2bma_overview.htm
Tip 5 - Build dashboards that answer questions, not just display numbers
Start with the decision you want to enable. Then pick the metrics.
Example dashboard slices and the questions they answer:
- Funnel Overview (visits → leads → MQLs → opportunities) - Where are prospects dropping off?
- Channel Performance (by UTM source/medium) - Which channels deliver pipeline at the target CPL/CPL? (cost data will need to be imported or joined)
- Email Program Health - Which nurture tracks produce conversions? Which emails have low CTOR?
- Account Engagement Summary (by account) - Which accounts show buying intent by engagement score and last activity?
- Attribution Summary (first touch / last touch / multi-touch) - What campaigns contributed to won deals?
Tip 6 - Use segmentation to build cleaner cohorts
Segmentation Rules and Dynamic Lists are powerful for cohort analysis.
How to apply them:
- Create lists for attribution cohorts (e.g., first-touch source, campaign of first conversion).
- Build dynamic lists for lifecycle stages (Marketing Engaged, Sales Accepted Leads).
- Use segmentation to isolate program performance (event attendees, webinar registrants).
Tip 7 - Clean data before you analyze
Data hygiene is non-negotiable.
Minimum clean-up checklist:
- Merge duplicates regularly. Pardot duplicate prospects create false engagement inflation.
- Normalize company names and job titles if you use grading/fit rules.
- Standardize time zones and date formats when exporting or comparing with Salesforce.
- Archive old lists and inactive assets to reduce noise.
Tip 8 - Use A/B testing, but analyze properly
A/B testing is not just about opens. Look at downstream behavior.
Make tests count:
- Define the primary metric upfront (CTR? conversion rate? pipeline influence?).
- Run tests long enough for statistical confidence on the chosen metric.
- Measure downstream conversion and revenue, not just the immediate metric.
Tip 9 - Export raw data for advanced analysis
If you need custom attribution, funnel visualizations, or cross-platform joins:
- Export prospects, activities, and custom redirect click data via Pardot exports or the Pardot API.
- Join with ad platform cost and GA data in a BI tool (Data Studio, Tableau, Power BI) or write simple joins in a spreadsheet for rapid tests.
Tip 10 - Automate reporting and set the right cadences
Humans forget to look. Automate what you can.
Suggestions:
- Schedule weekly snapshot exports for core metrics.
- Create automated Salesforce reports for sales and marketing alignment (e.g., new MQLs per week).
- Use email or Slack integrations for alerting on thresholds (e.g., sudden drop in form submissions).
Common pitfalls and how to avoid them
- Counting sessions vs. prospects - Align on what a conversion means - a visit or a prospect creation?
- Attribution double-counting - Ensure your model avoids crediting the same event multiple times across channels unless intentionally modeling multi-touch.
- Mistaking engagement score for fit - High engagement with low fit can waste SDR time. Use both grading (fit) and scoring (behavior).
- Ignoring latency - Deals close weeks or months after first touch. Always run backward-looking attribution checks.
Sample quick audit you can run right now (10–30 minutes)
- Check tracking code on main site and key landing pages.
- Open three recent email reports - verify opens vs clicks vs conversions.
- Verify the Pardot-Salesforce connector status and last sync time.
- Pull a list of active campaigns and scan naming consistency.
- Export a small prospect activity set and verify UTM values and first touch data.
Advanced ideas for power users
- Implement first-touch capture - On first visit, store the first UTM set in a custom prospect field for true first-touch analysis.
- Use custom redirects with unique UTM + redirect naming to track offline assets (presentations, PDFs).
- Build a retention / churn dashboard using engagement decay models (who stopped engaging and when?).
References and further reading
- Pardot (Account Engagement) help and release notes: https://help.salesforce.com/s/articleView?id=sf.pardot_overview.htm
- Connecting Pardot and Salesforce: https://help.salesforce.com/s/articleView?id=sf.pardot_connectors_overview.htm
- B2B Marketing Analytics overview: https://help.salesforce.com/s/articleView?id=sf.pardot_b2bma_overview.htm
Conclusion - what to do in the next 30 days
Week 1: Run the quick audit above. Fix any missing tracking code and sync issues.
Week 2: Standardize naming and tag your active campaigns. Create or update a simple Playbook.
Week 3: Build a 3-panel dashboard (Funnel Overview, Channel Performance, Top Emails) and export the data for a spot check.
Week 4: Run a first-touch capture test and set up one scheduled report for sales-marketing alignment.
Do these steps and you’ll stop wondering what happened to pipeline. You’ll know. Because your data will finally be telling the true story.