· marketing · 8 min read
Unlocking Hidden Insights: 5 Google Analytics Features You Aren't Using
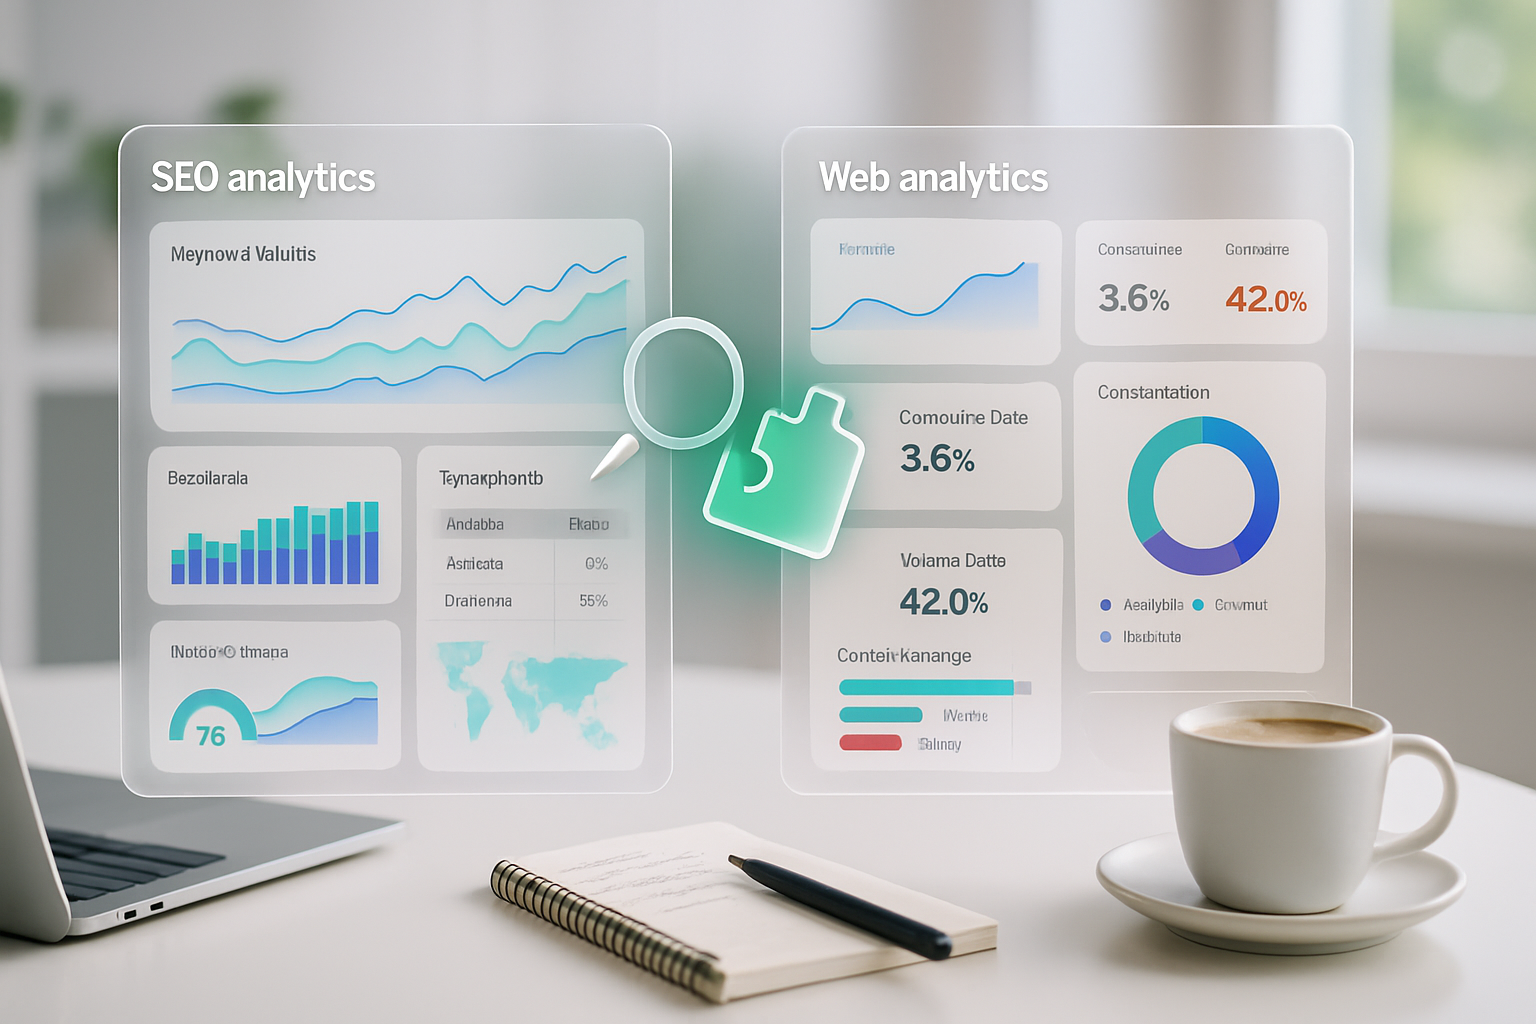
Discover five lesser-used Google Analytics (GA4) features - Explorations, Custom Dimensions, User-ID & Cohorts, Attribution Models, and BigQuery Export - with step‑by‑step usage, real-world use cases, sample queries, and implementation tips to surface hidden audience insights that can reshape your marketing strategy.

Introduction
Google Analytics can feel like an onion: the more layers you peel back, the more you discover. Beyond the standard Acquisition > Behavior > Conversion reports, GA4 (and the legacy Universal Analytics) hide powerful tools that reveal user behavior, attribution nuance, and raw event-level patterns - if you know where to look.
This article walks through five underused features that consistently uncover high-value insights for marketing teams: Explorations, Custom Dimensions & Metrics, User-ID & Cohort analysis, Attribution modeling & Model Comparison, and BigQuery export for raw data analysis. Each section explains what the feature is, why it matters, how to use it (practical steps), sample use cases, metrics to watch, and gotchas to avoid.
A quick note on GA4 vs Universal Analytics
Google has shifted to GA4 as the primary product. Some concepts from Universal Analytics map differently in GA4 (for example, Events and Parameters are more central). Where relevant, this article focuses on GA4 and links to official docs.
1) Explorations (Analysis Hub) - flexible, ad-hoc deep-dive reports
What it is
Explorations (GA4’s Analysis module) lets you build custom exploratory reports: funnel analysis, path analysis, segment overlap, cohort tables, and free-form tables with drag-and-drop dimensions and metrics.
Why it matters
Pre-built reports summarize behavior but often hide nuance. Explorations lets you test hypotheses quickly (e.g., “Do users who view X also convert more often?”) and visualize user journeys without sampling limits common in the UI.
How to use it (quick steps)
- In GA4 - Go to Explore (left menu) and create a new Exploration.
- Pick a technique (Funnel, Path, Segment overlap, Free form, Cohort)
- Add dimensions/metrics from your property. Use segments to isolate audiences (e.g., logged-in vs guest).
- For Funnels - set steps with events/page_view + filters, set funnel to open or closed to test strictness.
Sample explorations to run
- A funnel with steps - view product -> add to cart -> begin_checkout -> purchase. Compare converted vs non-converted users by device and traffic source.
- Path exploration starting from event “first_visit” to see common paths to conversion.
Metrics to watch
- Step conversion rate and drop-off at each funnel step
- Average time between funnel steps
- Path convert rate for top N paths
Pitfalls & tips
- Funnels are event-based in GA4 - ensure the relevant events are implemented and fired consistently.
- Use segments to compare cohorts side-by-side (e.g., organic vs paid traffic).
Official doc: https://support.google.com/analytics/answer/9303319?hl=en
2) Custom Dimensions & Metrics - capture business context GA doesn’t capture by default
What it is
Custom dimensions/metrics let you send additional contextual data (user-level or event-level) to GA - for example, membership tier, article category, content author, product SKU, or loyalty score.
Why it matters
Default GA fields often lack business semantics. Adding custom dimensions converts raw events into business-ready signals that segment and illuminate user intent.
How to use it (practical steps)
- Identify the data you need (e.g., logged_in_status, user_tier, article_type).
- Push those values as event parameters from your site/app (via gtag.js, GTM, or SDK).
- In GA4, go Admin > Property > Custom Definitions > Create custom dimension/metric and map to the sent parameter name.
- Wait for data (definitions apply to future hits). Then use them in Explorations and reports.
Example implementations
- E-commerce - send product_margin as a custom metric to measure acquisition channels that drive the most profitable sales (not just volume).
- Content - send article_category and author as custom dimensions to compare engagement and lifetime value by topic or author.
Metrics to watch
- Conversion rate and revenue by custom dimension (e.g., by loyalty tier)
- Engagement (events per session, average engagement time) segmented by custom dimension
Pitfalls & tips
- Limit the number of custom dimensions and metrics to what you’ll actually use. Track naming conventions and documentation.
- Remember custom definitions only apply to events collected after creation - they aren’t retroactive.
Setup docs: https://support.google.com/analytics/answer/10075209?hl=en
3) User-ID, User Explorer & Cohort Analysis - follow real user journeys and retention
What it is
User-ID and user-level reports help stitch device-level activity to a single identity (when you can assign a persistent ID). Cohort analysis groups users by a shared property (e.g., acquisition date) to study retention and LTV.
Why it matters
Cross-device journeys and retention trends are where many marketing questions live. Knowing not just what channel starts a user, but how they behave over weeks and across devices, changes growth tactics.
How to use it (practical steps)
- Implement a persistent ID (user_id) in your tracking when users authenticate or can be identified.
- Enable User-ID views (UA) or ensure user_id is populated in GA4 events.
- Use Explorations -> Cohort or the retention reports to measure user retention by acquisition cohort and by properties like campaign, plan, or onboarding experience.
Real-world use cases
- Compare lifetime revenue between users who completed onboarding vs those who didn’t.
- Understand the typical time-to-conversion across channels - do paid users convert faster than organic?
Metrics to watch
- Day-1 / Day-7 / Day-30 retention
- Lifetime value (revenue per user) by cohort
- Cross-device conversion lift (users who interact on multiple devices)
Pitfalls & tips
- Privacy & compliance - ensure user identifiers are hashed/managed in accordance with privacy laws and Google’s policies.
- Not all users can be identified - design analyses that fall back to user_pseudo_id or device-based measures when necessary.
User-ID doc: https://support.google.com/analytics/answer/9213390?hl=en
4) Attribution Models & Model Comparison - go beyond last-click
What it is
Attribution modeling and the Model Comparison Tool let you compare how credit for conversions is assigned across channels under different logic: last-click, first-click, linear, position-based, time decay, and data-driven models.
Why it matters
Marketing decisions (budget allocation, bid strategies, channel investment) depend on how you credit conversions. Default last-click skews toward lower-funnel channels - sophisticated models reveal upstream contributors.
How to use it (practical steps)
- In GA4 - open Advertising > Attribution to review attribution settings and the default reporting attribution model.
- Use Model Comparison (UA had a dedicated tool; in GA4, use the Attribution reports and data-driven options where available) to compare conversions, cost per acquisition, and conversion paths under different models.
- If you have linked Google Ads and cost data, compare ROAS across models to inform budget shifts.
Examples to try
- Compare last-click vs data-driven attribution - do branded paid search and display play earlier roles that feed organic conversion later?
- Run time-decay modeling for limited-lifespan campaigns (like product launches or seasonal promos) to favor recent touchpoints.
Metrics to watch
- Conversions and conversion value by channel under different models
- CPA/ROAS shifts across attribution models
- Fraction of conversions attributed to upper-funnel channels under non-last-click models
Pitfalls & tips
- Data-driven attribution requires sufficient data and correct conversion setup to be reliable.
- Attribution won’t solve bad tagging - ensure UTM parameters and campaign tagging are consistent.
Attribution docs: https://support.google.com/analytics/answer/9216061?hl=en
5) BigQuery Export - raw event data for advanced analysis and integrations
What it is
GA4 can export raw, event-level data into BigQuery (free tier available for GA4 properties). BigQuery unlocks SQL queries over your entire event stream, and enables joins with CRM, ad spend, or product data.
Why it matters
Pre-aggregated reports hide variability. BigQuery lets you: build unsampled, custom calculations (e.g., first-touch LTV), run sequence/path queries, compute custom attribution rules, or export to BI tools for advanced modeling.
How to use it (practical steps)
- Link BigQuery to your GA4 property - Admin > Product Links > BigQuery Linking and follow the setup.
- Data flows daily (and streaming if enabled) into a dataset with tables - events_YYYYMMDD and intraday.
- Use SQL to query user_pseudo_id (device-level) or user_id (if you send it) to reconstruct sessions and journeys.
Sample BigQuery query (GA4) - top 10 event paths by count (simplified)
-- This is a simple example that builds a user/event path sequence
WITH ordered_events AS (
  SELECT
    user_pseudo_id,
    event_timestamp,
    event_name,
    ROW_NUMBER() OVER (PARTITION BY user_pseudo_id ORDER BY event_timestamp) AS rn
  FROM `project.dataset.events_*`
  WHERE _TABLE_SUFFIX BETWEEN '20250101' AND '20250131' -- date range
)
SELECT
  STRING_AGG(event_name, ' > ' ORDER BY rn) AS path,
  COUNT(DISTINCT user_pseudo_id) AS users
FROM ordered_events
GROUP BY user_pseudo_id
ORDER BY users DESC
LIMIT 10;
(Adapt the query to use user_id, filter to sessions, or join with event_params to only include page_view or specific events.)
Use cases for BigQuery
- Build a custom multi-touch attribution model using your own business rules.
- Join GA events with internal CRM to compute true LTV by acquisition campaign.
- Detect anomalies or cohort behaviors via machine learning without the constraints of the GA UI.
Metrics to watch
- Retention curves computed for business-specific time windows
- Revenue per user by campaign after joining purchase data
- Sequence frequency of specific conversion paths
Pitfalls & tips
- Costs - BigQuery charges for storage and query processing. Use partitioned tables, preview tables, and limit scanned bytes in queries.
- Data governance - manage who can access raw data; remove PII and follow privacy rules.
BigQuery export docs: https://support.google.com/analytics/answer/9823238?hl=en
Conclusion and quick next steps
Start with a single experiment: pick one question you can’t answer with standard reports and map it to one of the features above. Examples:
- Question - “Which article categories drive subscribers?” -> implement article_category as a custom dimension and run an Exploration.
- Question - “Are we under-crediting display campaigns?” -> run a Model Comparison in Attribution and review conversion credit.
- Question - “Do high-LTV users follow a particular onboarding path?” -> enable user_id, export to BigQuery, and analyze retention cohorts.
Document your tracking plan, tag consistently, and iterate: these hidden features become exponentially more valuable as your event taxonomy and custom dimensions mature.
Further reading
- GA4 Explorations: https://support.google.com/analytics/answer/9303319?hl=en
- Custom definitions (GA4): https://support.google.com/analytics/answer/10075209?hl=en
- User-ID overview: https://support.google.com/analytics/answer/9213390?hl=en
- Attribution in GA4: https://support.google.com/analytics/answer/9216061?hl=en
- BigQuery export for GA4: https://support.google.com/analytics/answer/9823238?hl=en