· marketing · 6 min read
Maximizing User Engagement: 10 Hotjar Features You’re Probably Not Using
Uncover 10 underused Hotjar features - from heatmap comparisons to recruit and custom events - with practical tactics to boost engagement and lift conversions. Learn how to set each up, what to measure, and real examples for quick wins.

What you’ll get from this post
You’ll walk away with ten practical Hotjar features (many overlooked) and a clear plan to use them to find friction, validate fixes, and increase conversions. Read fast. Act faster. See results.
I’ll show you how to use each feature, why it’s underused, quick setup steps, and the exact metrics to watch.
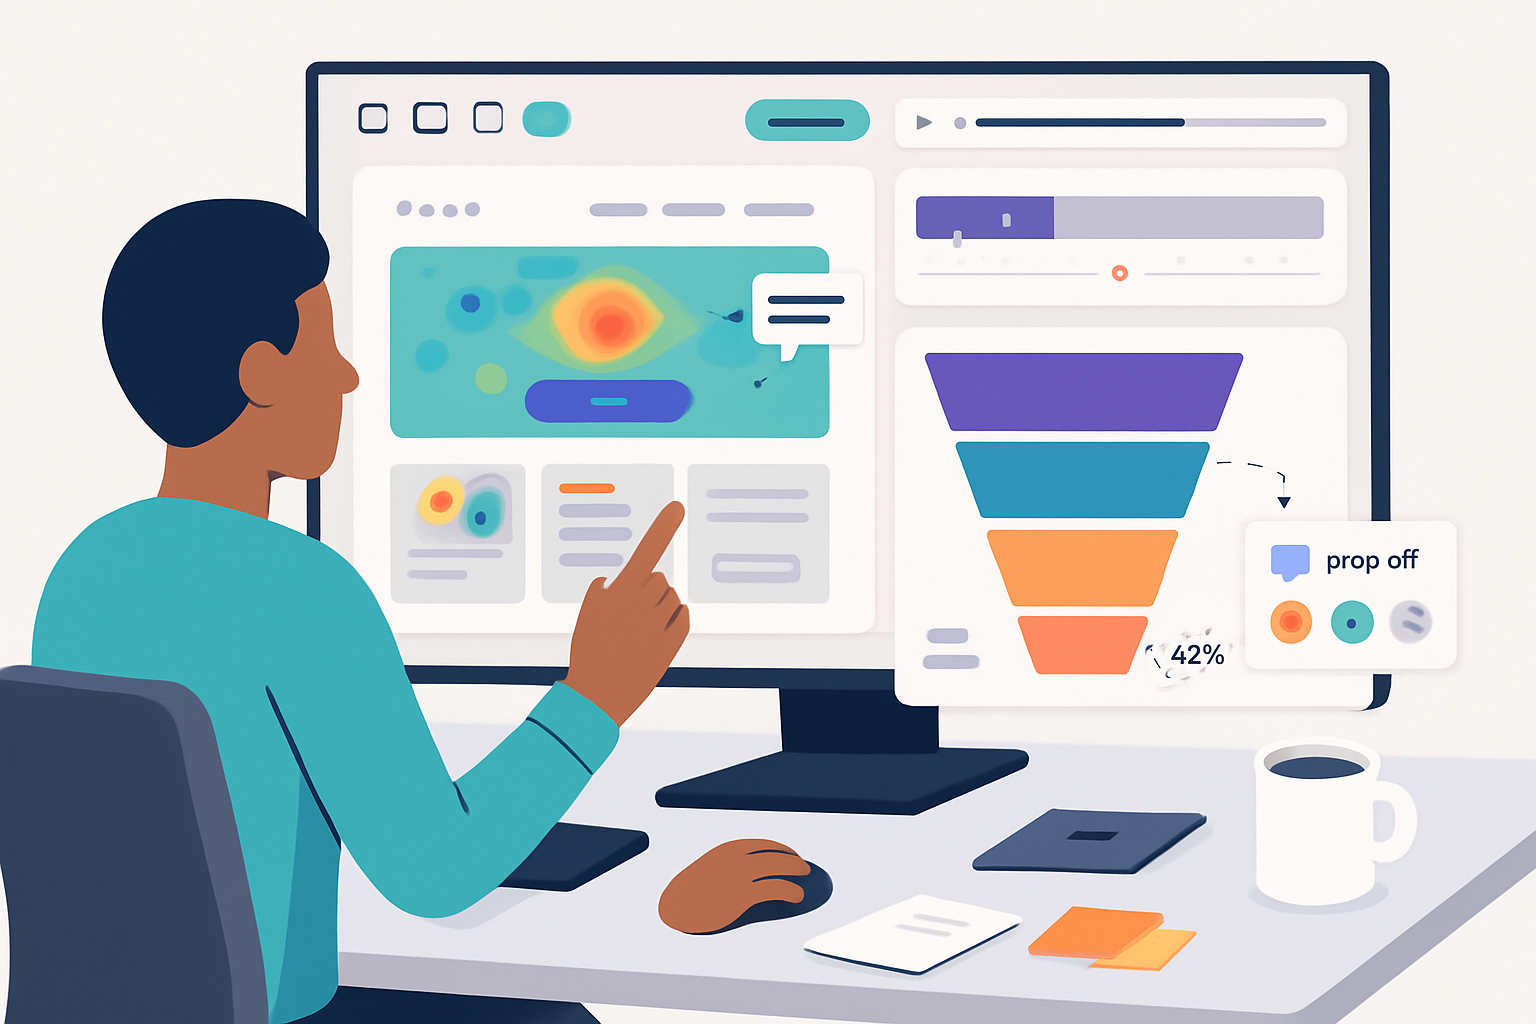
1) Advanced heatmaps: click, move, scroll - and target them well
Heatmaps are obvious. But most teams stop at a single desktop click-map and call it a day. Don’t.
Why it’s underused
- Teams create one heatmap and forget to segment by device or traffic source. Context matters.
How to leverage it
- Create separate heatmaps for desktop, tablet, and mobile.
- Use URL targeting (and wildcards) to focus a specific funnel page (e.g., /pricing*, /checkout).
- Build a hover (move) map to spot visual affordances and a scroll map to find where content is missed.
Quick setup
- In Hotjar, create a new Heatmap.
- Set target pages (URL contains /pricing).
- Select device filters when you review results.
Metrics to watch
- Click density on primary CTAs.
- Scroll depth drop-off (where 90% of users stop).
- Interaction mismatch (many clicks on non-clickable elements).
Resources: Hotjar Heatmaps docs: https://help.hotjar.com/hc/en-us/articles/360038073933-Heatmaps
2) Heatmap comparisons: A/B-like insights without code
You can compare heatmaps across versions or date ranges to validate visual changes quickly.
Why it’s underused
- People treat heatmaps as a snapshot. Comparisons show whether a redesign actually moved behavior.
How to leverage it
- Before/after a UI change, capture heatmaps for both versions.
- Compare mobile vs desktop for the same page-CTAs often behave differently.
Quick setup
- Create two heatmaps using URL targeting (e.g., /pricing?v=a and /pricing?v=b) and compare.
Metrics to watch
- Relative change in click share on target CTA.
- New hotspots appearing on elements you expect users to engage with.
3) Session recordings with smart filters: hunt down rage and frustration
Recordings are gold, but only if you find the right sessions.
Why it’s underused
- Teams watch random sessions. They don’t narrow to the sessions that reveal pain - rage clicks, console errors, or form abandonment.
How to leverage it
- Use Hotjar’s built-in filters - rage clicks, console errors, slow page loads, UTM source, user device.
- Search for sequences - page > click > back > form abandon.
Quick setup
- Open Recordings.
- Apply filters like “Rage Clicks > 0” and “Console Errors > 0”.
- Watch sessions of users who experienced problems.
Metrics to watch
- % of sessions with rage clicks.
- Frequency of console errors tied to conversion steps.
Docs: https://help.hotjar.com/hc/en-us/articles/360034729072-Recordings
4) Segment recordings by behavior and acquisition
A recording of “a user” is useless without context. Segment aggressively.
Why it’s underused
- Teams rarely combine behaviour and acquisition data - e.g., new users from paid search on mobile.
How to leverage it
- Filter recordings by Last Touch UTM, new vs returning, geography, device, or custom events.
- Watch how a high-intent cohort (search ad click) behaves vs organic.
Quick setup
- Add UTM parameters to campaign URLs and filter recordings by utm_campaign or utm_source.
Metrics to watch
- Drop-off points by cohort.
- Differences in time-to-first-action between cohorts.
5) Funnels + recordings: watch drop-offs in action
Funnels tell you where people leave. Recordings tell you why.
Why it’s underused
- People build simple funnels but don’t tie recordings to specific funnel steps.
How to leverage it
- Create a funnel of your checkout or signup flow.
- Watch recordings only of sessions that exited at a specific funnel step.
Quick setup
- Build a funnel (e.g., Landing > Pricing > Start trial).
- Click the drop-off step and view associated recordings.
Metrics to watch
- Step conversion rates.
- Repeated behaviors at the drop-off (e.g., searches in page, repeated clicks).
Docs: https://help.hotjar.com/hc/en-us/articles/360037458131-Funnels
6) Form Analysis: field-level friction with time-to-complete
Forms hide a lot of friction: long fields, validation errors, or confusing labels.
Why it’s underused
- Teams often only look at form-level completion rates and ignore per-field behavior.
How to leverage it
- Use Form Analysis to measure field drop-off, time to complete, and error occurrences.
- Reorder fields, simplify inputs, or prefill common values based on findings.
Quick setup
- Enable Form Analysis for the form’s page and review field-level metrics after collecting enough samples.
Metrics to watch
- Fields with highest abandonment.
- Average time spent on each field.
Docs: https://help.hotjar.com/hc/en-us/articles/360021637492-Form-Analysis
7) Incoming Feedback: on-page micro-surveys with context
The little feedback widget (thumbs or emoji) is small but incredibly powerful.
Why it’s underused
- Teams stick to long surveys or analytics and miss quick contextual feedback tied to a page.
How to leverage it
- Target the feedback widget to specific pages where you expect confusion (checkout, settings).
- Ask a single clarifying question after a negative rating and capture the screenshot.
Quick setup
- Configure Incoming Feedback and target it to the high-friction page.
- Ask one simple follow-up when users click a low score (e.g., “What’s missing?”).
Metrics to watch
- Frequency and sentiment of feedback.
- Recurring themes in free-text comments.
Docs: https://help.hotjar.com/hc/en-us/articles/360038473353-Incoming-Feedback
8) On-site Surveys: ask the right users at the right time
Surveys let you ask questions that analytics can’t. But timing is everything.
Why it’s underused
- Surveys are often shown to everyone and yield noisy answers.
How to leverage it
- Target surveys to cohorts (e.g., users who reached pricing but didn’t convert).
- Use short, single-purpose surveys (1–3 questions) and show them at contextual moments.
Quick setup
- Create a survey and set targeting rules (URL, session duration, device).
- Ask one hypothesis-testing question (e.g., “What prevented you from starting the trial?”).
Metrics to watch
- Answer distribution for the key question.
- Completion rate of the survey.
Docs: https://help.hotjar.com/hc/en-us/articles/360038473373-Surveys
9) Recruit participants for user tests - directly from your live site
User interviews are expensive to source. Hotjar Recruit simplifies recruiting real visitors.
Why it’s underused
- Teams assume recruiting is external and costly. They miss qualified users already visiting the site.
How to leverage it
- Run a short recruit campaign targeting the audience you want and offer a small incentive.
- Combine with session recordings to pre-screen participants.
Quick setup
- Create a Recruit campaign and set targeting rules (country, device, page).
- Collect contact details and book interviews.
Metrics to watch
- Number of qualified respondents.
- Dropout rate from sign-up to interview.
Docs: https://help.hotjar.com/hc/en-us/articles/360038473673-Recruit
10) Custom events, triggers and integrations: connect Hotjar to your experiment stack
Hotjar becomes exponentially more valuable when it knows your product events and talks to other tools.
Why it’s underused
- Teams treat Hotjar as isolated; they don’t push custom events (e.g., “modal_open”) or tie Hotjar into Analytics and CDPs.
How to leverage it
- Send custom events with hj(‘event’, ‘name’) to tag recordings and heatmaps for specific product actions.
- Integrate with Google Analytics, Segment, or Slack to route insights to the right owner.
Quick setup
- Add hj(‘event’, ‘signup_modal_open’) in your frontend code where appropriate.
- Filter recordings by that event to watch only relevant sessions.
Metrics to watch
- Event-tagged session conversion rates.
- Changes in behavior before/after event triggers.
Docs: https://help.hotjar.com/hc/en-us/articles/115011640807-Custom-Events and https://help.hotjar.com/hc/en-us/articles/360038473413-Integrations
Putting it together: a simple experiment loop you can run this week
- Hypothesis - “Our pricing page has unclear CTAs causing drop-off.”
- Evidence gathering - heatmaps (click and scroll) + recordings filtered for paid-search cohort.
- Qual inputs - run an on-page survey targeting pricing drop-offs and enable Incoming Feedback.
- Fix - simplify CTA copy and move key feature bullets higher.
- Validate - compare heatmaps and funnel conversion rates after the change; watch recordings for reduced rage clicks.
Do this repeatedly. Small cycles beat large, rare launches.
What success looks like (metrics to track across features)
- Conversion lift in the funnel step you changed.
- Reduced form abandonment on key fields.
- Decrease in rage clicks and console errors on conversion pages.
- Higher NPS / positive feedback on targeted pages.
- Faster time-to-complete for critical flows.
Final thought
Hotjar is more than pretty pictures of clicks. It’s a toolkit to turn qualitative signals into quantitative improvement-if you use it as a loop: observe (heatmaps & recordings), ask (surveys & feedback), iterate (A/B + funnels), and validate (comparisons & repeat recordings). Do that consistently, and your engagement metrics will stop being guesses and start becoming predictable.


