· marketing · 7 min read
From Data to Action: How to Use Crazy Egg Insights to Drive Real Results
A practical, step-by-step guide to converting Crazy Egg analytics - heatmaps, scrollmaps, recordings, funnels and confetti - into prioritized experiments and lasting business outcomes: better UX, higher conversions, and more revenue.
Introduction - what you’ll achieve and why it matters
You will leave this article with a clear, repeatable process to turn Crazy Egg signals into business outcomes: prioritized opportunities, testable hypotheses, efficient experiments, and measurable lifts in conversion or revenue. You’ll learn how to read heatmaps and recordings for real problems, how to prioritize what to test, and how to run experiments that move the needle. Read one focused section at a time. Then act.
Why Crazy Egg data is different - and why that matters
Crazy Egg gives you visual, behavioral evidence: where people click, how far they scroll, which elements cause frustration, and how different segments behave. These are not guesses. They’re observable user behaviors you can turn into concrete hypotheses. Use them right, and you can reduce guesswork, speed up learning, and make changes that actually improve business KPIs.
Core metrics to tie every insight to business outcomes
Before digging into dashboards, lock in the metrics that matter for your product or page. Tie every Crazy Egg insight to at least one of these:
- Conversion Rate (CR) - the percent of visitors who complete your primary goal (purchase, sign-up, lead form).
- Revenue per Visitor (RPV) or Average Order Value (AOV) - for ecommerce, this ties UI changes to dollars.
- Funnel Completion Rate - the percent who progress from Step A to Step B in your checkout or signup funnel.
- Bounce Rate & Time on Page - quick proxies for engagement and content relevance.
- Form Completion Rate / Field Drop-off - identify friction inside forms.
Always report experiments against one primary metric and one or two guardrail metrics (e.g., session length, revenue, error rate).
The 6-step framework: From data to action
- Define a clear outcome and baseline
Start with a measurable goal (example: increase free-trial signups from 3.2% to 4.0% in 8 weeks). Record the baseline, sample size, and current funnel conversion rates so you know what “better” looks like.
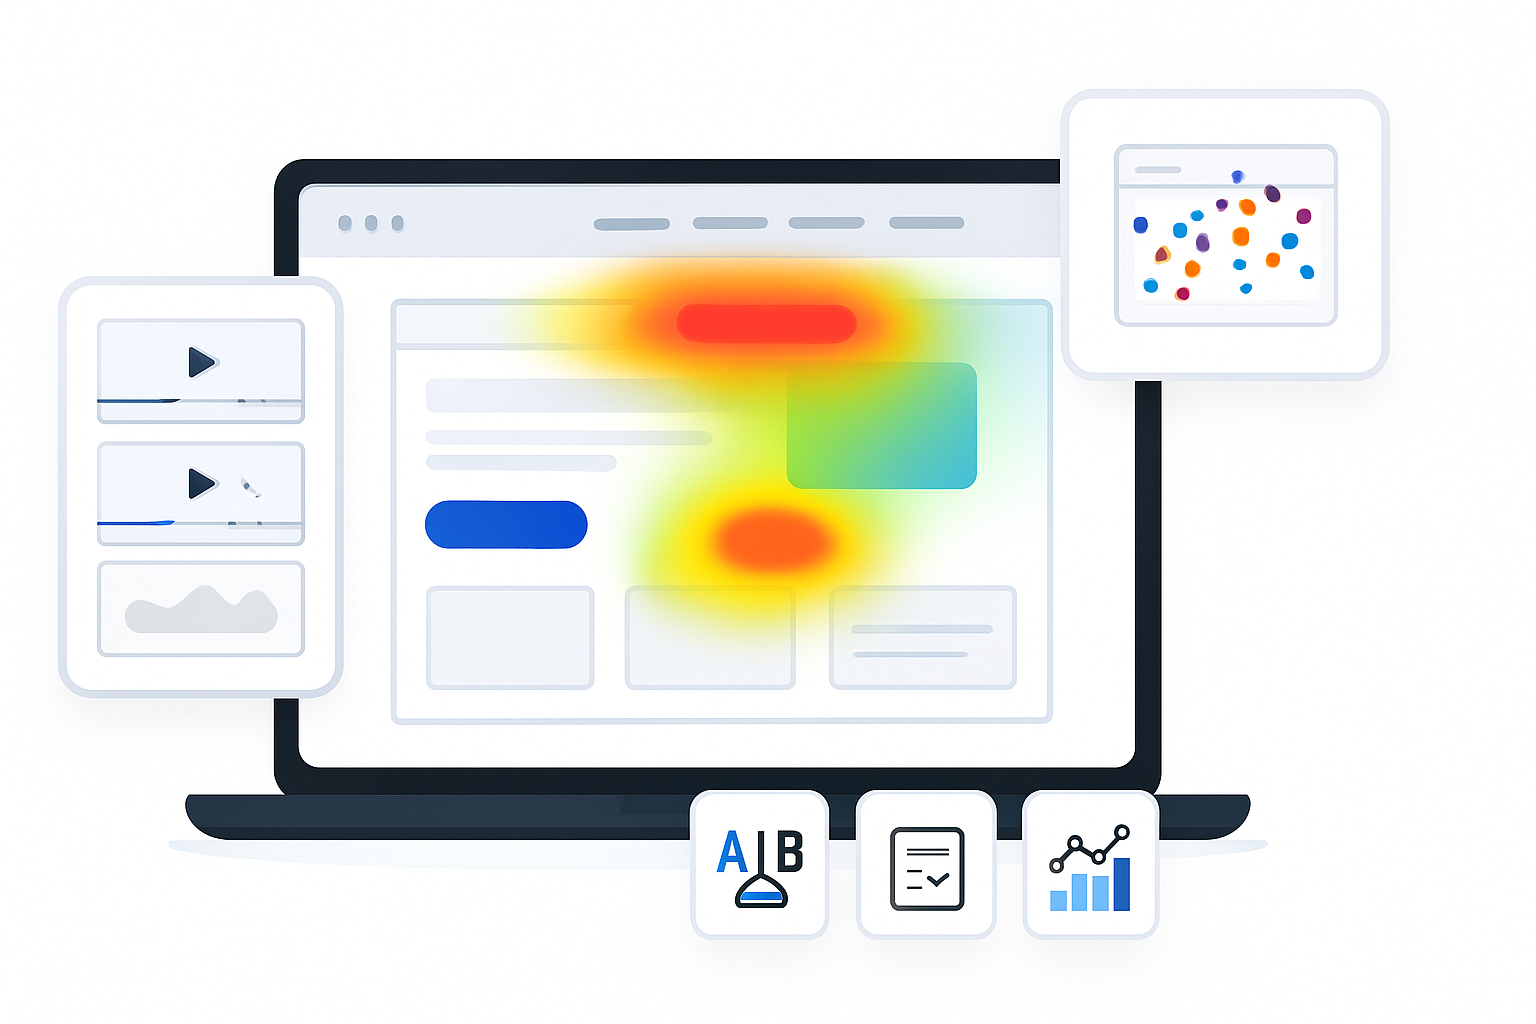
- Collect the right Crazy Egg evidence
Use these Crazy Egg tools and what to look for in each:
- Heatmaps - hotspots of clicks; unexpected clicks on non-clickable elements indicate UX expectations.
- Scrollmaps - where users stop engaging; the fold doesn’t mean much alone, the exact drop-off point does.
- Confetti - click segmentation by traffic source or campaign; reveals whether different audiences behave differently.
- Recordings - watch real sessions to see frustration, hesitation, form errors, and navigation loops.
- Funnels / Snapshots - where users drop off between steps and how segments behave at each step.
(See Crazy Egg features for details: https://www.crazyegg.com/features)
- Diagnose the problem - convert signals into hypotheses
Translate patterns into causal hypotheses. Examples:
Observation - heatmap shows many clicks on an image that isn’t clickable.
Observation - scrollmap shows 60% of visitors drop between headline and CTA.
Observation - recordings show users repeatedly trying to enter a promo code in the wrong field.
A practical hypothesis template (use this)
“Because [evidence from Crazy Egg], we believe [change] will increase [metric] by [expected lift].”
Example:
“Because the heatmap shows heavy clicks on the product image and recordings show users trying to expand it, we believe adding an image zoom CTA will increase product-detail views and lift add-to-cart rate by 12%.”
- Prioritize using ICE (Impact, Confidence, Ease)
You will have more ideas than bandwidth. Prioritize experiments using ICE scoring: rate Impact, Confidence, and Ease on a 1–10 scale and compute ICE = (Impact × Confidence × Ease) / 10. Higher scores go first.
Quick example:
- Image zoom CTA - Impact 7, Confidence 8, Ease 9 → ICE = 50.4
- Headline rewrite - Impact 9, Confidence 6, Ease 7 → ICE = 37.8
Use ICE to build a 4–8 week roadmap of tests.
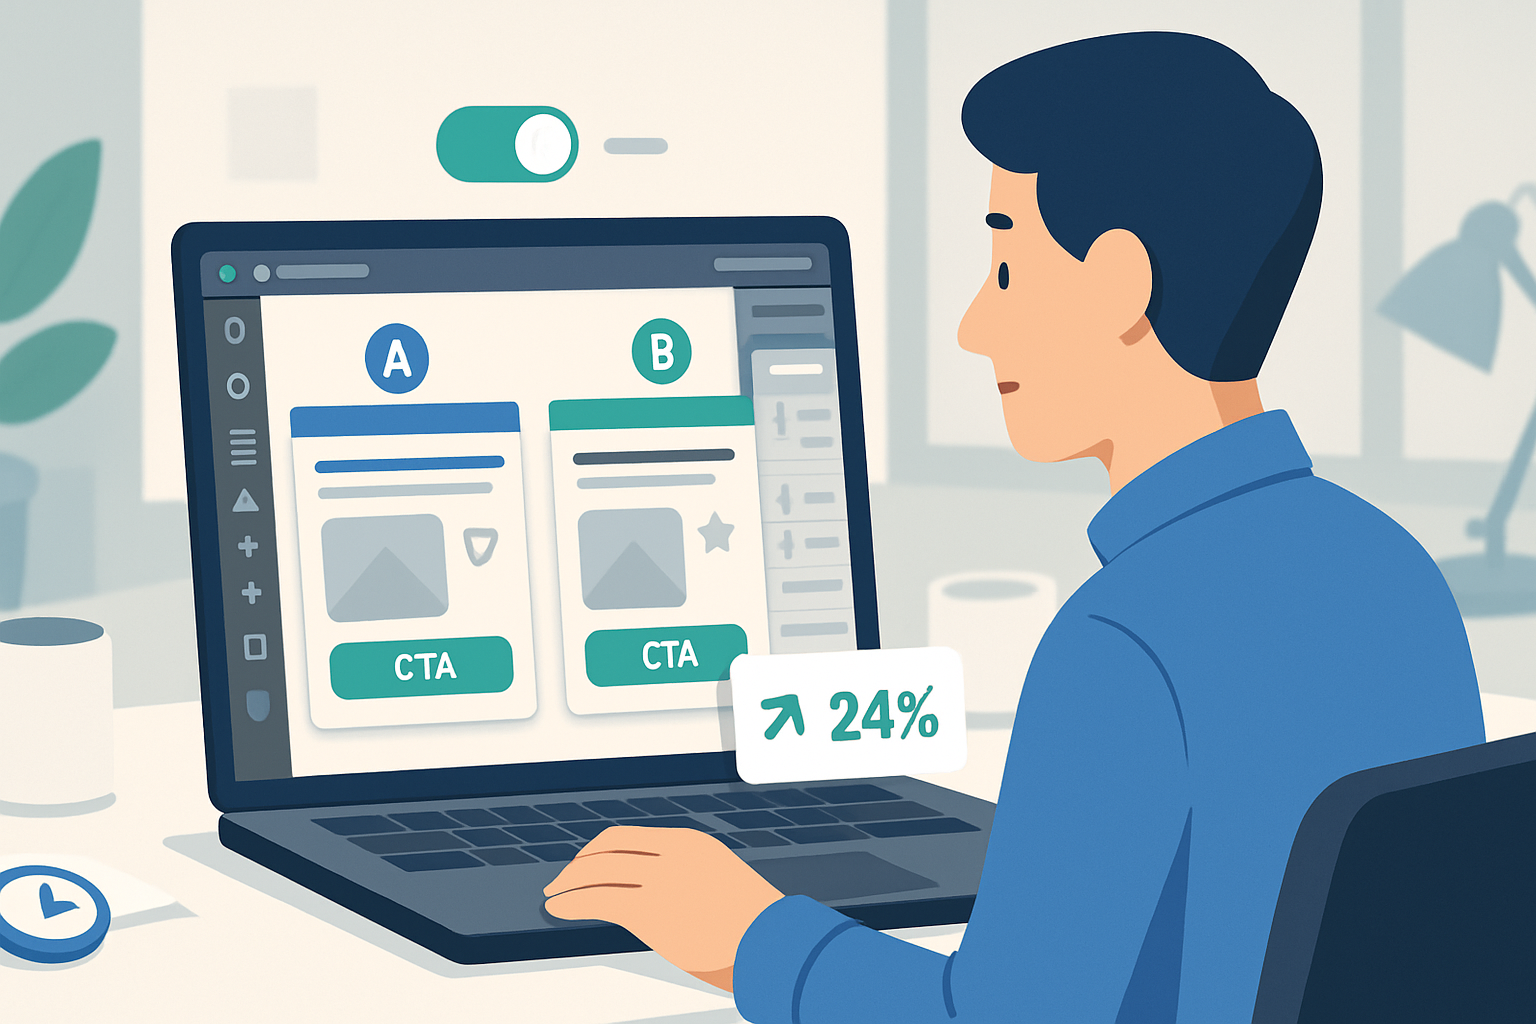
- Design and run controlled experiments
Best practices for A/B tests and experiments:
- Keep tests focused. Test one major concept at a time (e.g., CTA copy or layout - not both).
- Segment tests when Crazy Egg shows behavior differences (mobile vs desktop, organic vs paid).
- Use a reliable A/B tool and track events in your analytics and backend (conversion, revenue).
- Predefine duration and sample size. Don’t stop early on small sample sizes.
Quick sample experiment plan
- Hypothesis - Add image zoom CTA will increase add-to-cart rate.
- Variant A (control) - current page.
- Variant B (treatment) - image with clear zoom icon and click-to-zoom overlay.
- Primary metric - add-to-cart rate.
- Guardrail metrics - page load time, bounce rate.
- Duration - minimum 14 days or until reaching required sample size.
- Segments - desktop traffic only (based on confetti findings).
Statistical significance and sample size
You don’t need an advanced statistics degree, but you should respect minimum sample sizes and avoid peeking too early. Use a sample-size calculator or resources like Evan Miller’s A/B testing guide for practical thresholds: https://www.evanmiller.org/ab-testing/sample-size.html. If your baseline conversion is low, you’ll need larger samples or larger expected effect sizes.
- Learn, iterate, and scale
When a test wins: implement the change, roll out gradually (if needed), and monitor post-launch metrics for at least two business cycles. When tests fail: dig back to Crazy Egg recordings and confetti segments to understand why, then generate a new hypothesis. Maintain a test log with hypothesis, variant screenshots, results, and lessons learned.
Hands-on examples and what to look for
Ecommerce - increase add-to-cart and checkout completion
- Heatmaps - users click product thumbnails expecting larger views → add a zoom/expand behavior.
- Recordings - users abandon checkout at shipping selection due to unclear costs → show shipping estimate earlier.
- Funnel snapshots - high drop-off on payment step → simplify payment fields, add autofill, or display secure badge.
SaaS landing page - increase trial signups
- Confetti - paid search traffic clicks CTA less than organic → create a landing variant that matches ad messaging.
- Scrollmap - most paid traffic bounces before the pricing section → bring pricing and outcomes higher on the page.
- Recordings - users hesitate at form step asking for phone number → make phone optional, or add why-phone note.
Lead gen / B2B - increase qualified leads
- Heatmaps - contact form is below the fold and CTA is overlooked → emphasize CTA in hero; test a short lead-capture modal.
- Recordings - users try to click email address expecting to open their client → make email clickable and open a short pre-filled contact modal.
Practical checklists and templates
Pre-test checklist
- Primary metric and guardrails defined.
- Baseline numbers captured.
- Audience segmentation chosen.
- Test variant created and QA’d (mobile + desktop).
- Analytics events and tracking verified.
- Minimum duration and sample size set.
Post-test checklist
- Results compared to baseline and guardrails.
- Statistical significance or sufficient power confirmed.
- Observed secondary effects documented (load time, complaints, revenue changes).
- Winner implemented or hypothesis revised and re-prioritized.
Common interpretation traps (avoid these)
- Confusing correlation with causation - a heatmap hotspot shows interest - not proof that a CTA will convert. Use it to form a hypothesis, then test.
- Cherry-picking segments - segment differences are powerful; but don’t declare victory on a tiny segment unless that’s your target.
- Stopping early - temporary blips happen. Allow tests to reach planned sample sizes.
- Measuring irrelevant metrics - optimize for the business metric, not the vanity metric.
When Crazy Egg shows conflicting signals
If heatmaps suggest users click a non-clickable element, but recordings show they rarely persist to click an alternate CTA, then the problem may be discoverability plus messaging. Tackle both: make the element clickable or add a clear CTA nearby, and test messaging variations to improve intent.
Scaling a results-driven optimization program
- Standardize experiment documentation. Use a spreadsheet or experiment tracking tool.
- Make learning public. Share key wins and losses with product, design, marketing, and customer support.
- Rotate CRO sprints - run 2–4 concurrent small tests while planning 1–2 higher-impact experiments.
- Tie wins to business results regularly - conversions, revenue, lifetime value.
Tools and integrations to amplify Crazy Egg insights
- A/B testing platforms - Optimizely, VWO, Google Optimize (deprecated; check replaced solutions), or built-in experimentation in your stack.
- Analytics - Google Analytics or your backend analytics to validate lift in conversion and revenue.
- Session replay + product analytics - use Crazy Egg recordings alongside tools like Hotjar or full-product analytics to enrich context.
Further reading and resources
- Crazy Egg features: https://www.crazyegg.com/features
- ICE framework overview: https://growthhackers.com/growth-studies/ice-framework
- A/B testing sample sizes and stats: https://www.evanmiller.org/ab-testing/sample-size.html
Parting advice - turn evidence into actions that scale
Crazy Egg gives you a clear window into user behavior. But a dashboard alone won’t move metrics. Turn those signals into prioritized hypotheses, run proper experiments, and measure the impact against business goals. Iterate quickly. Learn publicly. Prioritize ruthlessly. When insights become tested changes and tested changes become measurable lifts, analytics stops being a report and becomes growth.