· creativity · 6 min read
Creating Visme Projects: Tips from Professional Designers on Efficiency and Creativity
Learn practical, professional tips to produce beautiful Visme projects faster without sacrificing originality. From workflows and timeboxed templates to visual rules, brand kits, and data-viz shortcuts - this guide gives you the exact steps designers use to be both efficient and creative.
What you’ll be able to do after reading this
Finish a polished Visme project in 15, 30, or 60 minutes. Produce original visuals that look like they were crafted by a design team. Reuse assets and workflows so each new project gets faster and better.
Short hook. Big result.
Why efficiency doesn’t have to mean cookie-cutter
Many people assume speed forces compromise. It doesn’t. When you apply structure to the creative process - constraints, systems, repeatable blocks - you convert creative friction into creative fuel. The goal is not just to get faster. It’s to spend your time on the decisions that matter.
Start like a pro: a 3-minute project brief
Before you open Visme, answer three crisp questions. Do this in three minutes or less.
- Who is the audience? (e.g., marketing managers, C-level, students)
- What is the single message or action? (e.g., register, read, buy, understand Q3 revenue)
- What format and dimensions? (social post, presentation, infographic, printable)
This mini-brief focuses your design choices and eliminates late-stage rewrites.
Set up once, save hours: the Brand Kit and asset organization
Professional designers make foundational decisions once and reuse them forever. In Visme, that means: create a Brand Kit (colors, fonts, logo variants), organize an assets folder, and build a small icon library you like.
Why it works: consistency saves decision time and prevents visual noise. When your type scale and color system are ready, every layout looks intentional.
Resources:
- Visme’s help and branding overview: https://visme.co/help/
- Read about visual-perception foundations (Gestalt principles): https://en.wikipedia.org/wiki/Gestalt_psychology
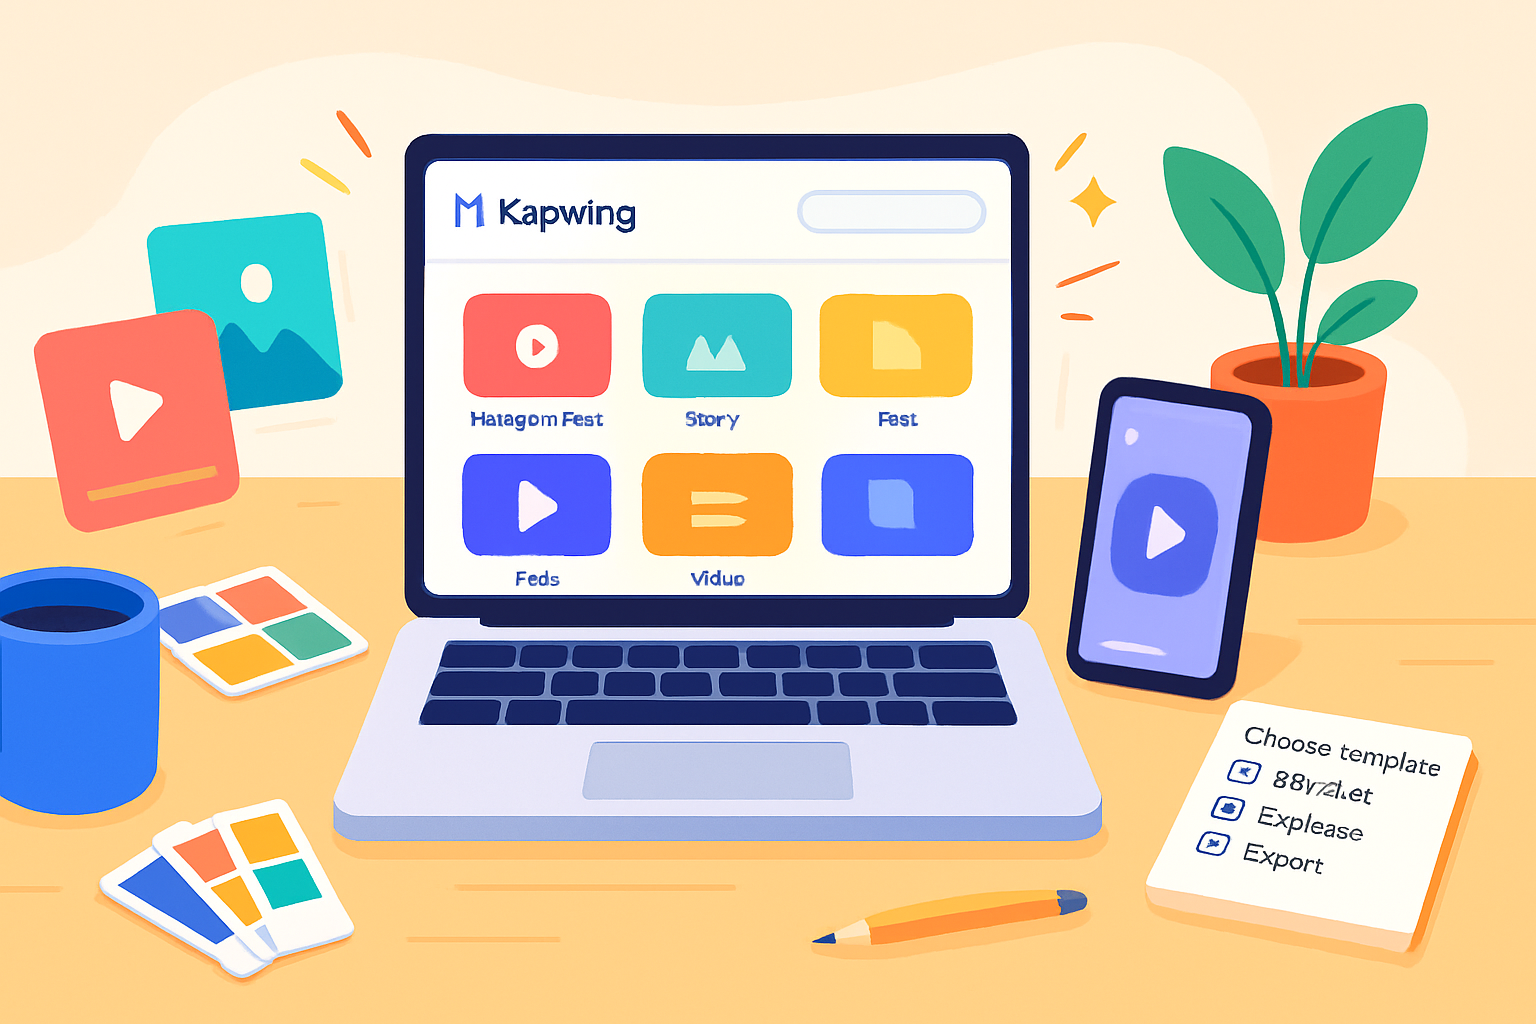
Templates are your starting point - not the destination
Use professionally designed Visme templates to skip the blank page. Then customize deliberately:
- Replace placeholder imagery with photos or unique illustrations.
- Apply your Brand Kit colors and fonts.
- Rework the headline and hierarchy to match your message.
Template tip: keep the layout’s rhythm (margins, spacing) but change the content blocks so the result reads as original.
Timeboxed workflows: examples you can use now
These are the exact routines designers use depending on how much time they have.
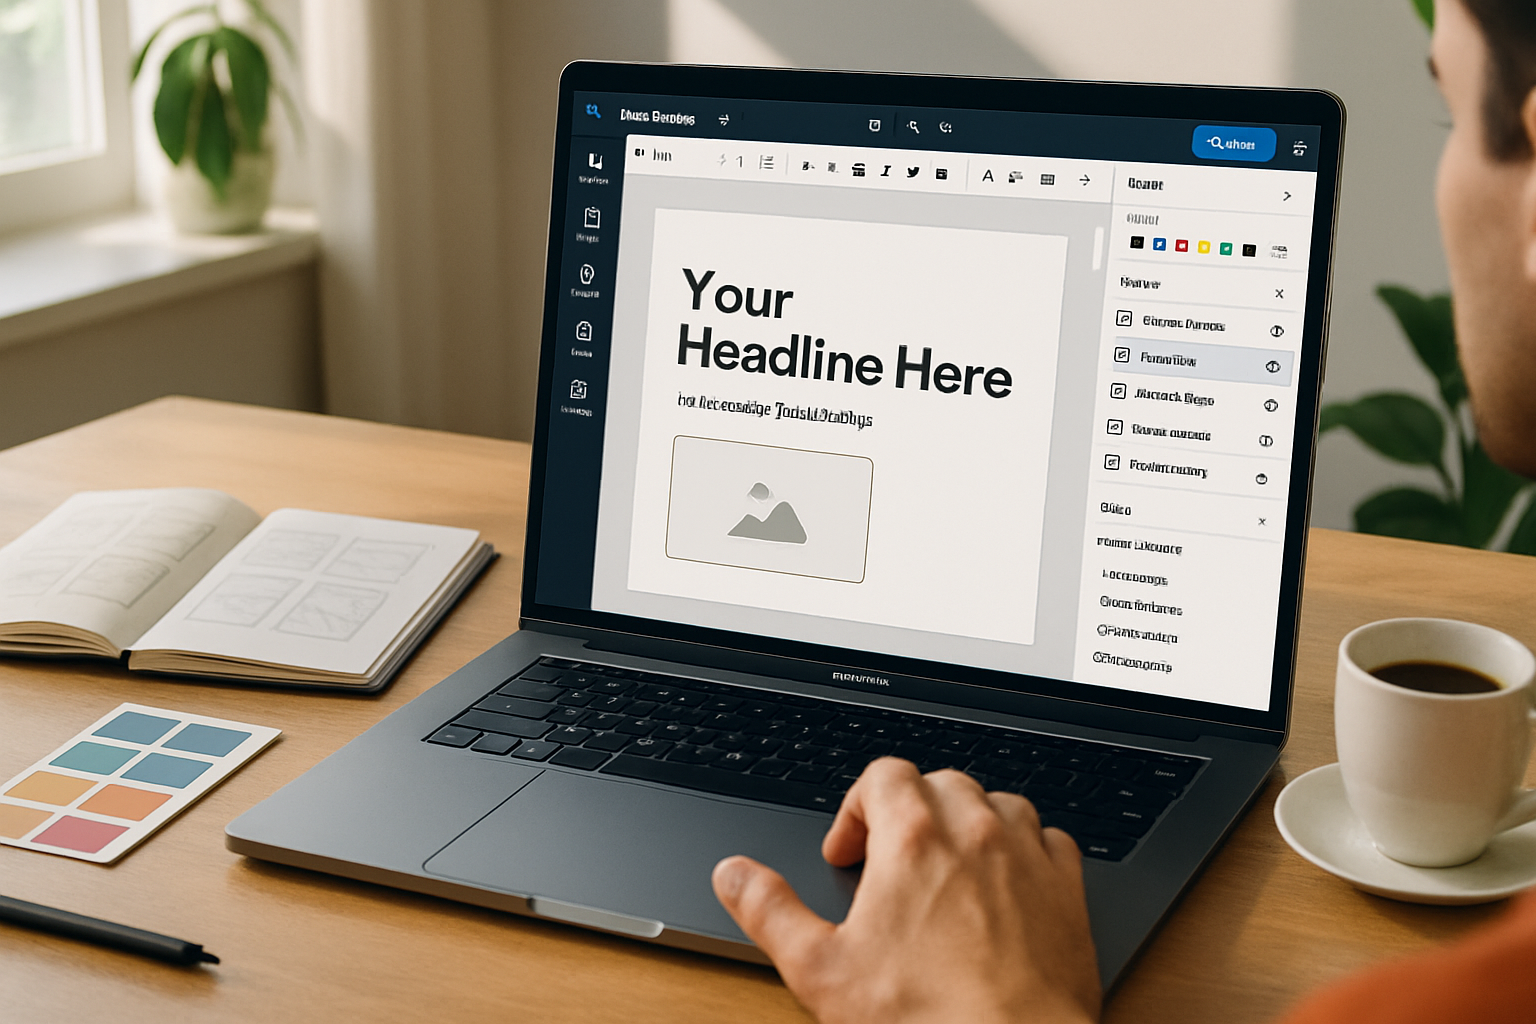
15-minute social graphic
- Open a relevant template.
- Replace headline and subhead.
- Swap photo or illustration and apply a brand color overlay.
- Export at platform size.
30-minute slide or infographic
- Choose a 3–5 block template.
- Replace copy for each block.
- Insert two charts or icons; apply brand colors.
- Quick polish - align using guides, fix contrast, export.
60-minute data-driven report cover + 3 slides
- Build a title slide from grid + large stat.
- Create one data slide using a Visme chart, then duplicate layout for other slides.
- Add micro-animations for emphasis.
- Final pass - check type sizes, export PDFs for sharing.
These workflows are intentionally constrained. Constraints force clarity.
Layout and composition: quick rules to guarantee polish
- Use a clear grid. Snap to it.
- Give elements breathing room - increase padding rather than shrinking text.
- Visual hierarchy = size + weight + color. Make the most important item the tallest, boldest, or most saturated.
- Limit fonts to two families - one for headings, one for body.
For deeper reading on color and hierarchy, see a practical guide: https://www.smashingmagazine.com/2010/01/color-theory-for-designers-part-1-the-meaning-of-color/
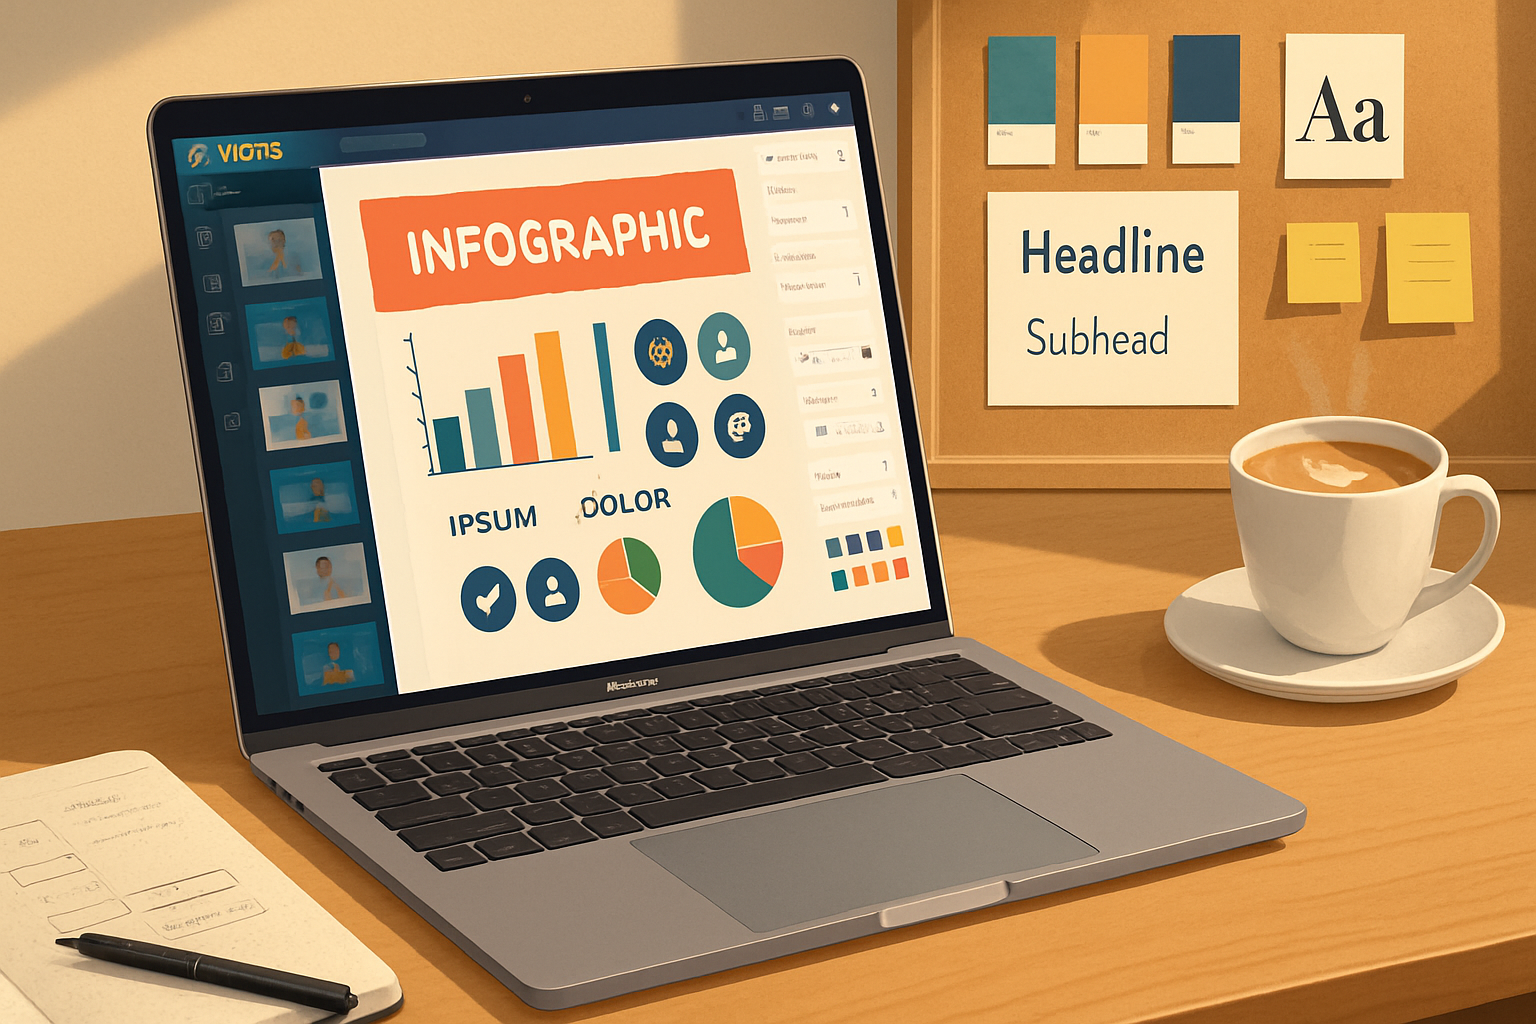
Data visualization: clarity over complexity
Visme shines for charts and infographics. Use these rules:
- Start with the story. Which number should the reader remember? Lead with it.
- Choose the right chart type - bar for comparisons, line for trends, donut/pie only for very simple shares.
- Label for readability - show values for the key bars/points rather than forcing readers to hunt.
- Use color sparingly - 1–2 highlight colors and muted neutrals for context.
Tip: Visme’s built-in charts let you paste data quickly. Create a template chart with your brand colors; then duplicate it each time.
Speed features and micro-workflow habits
- Duplicate slides/artboards instead of rebuilding.
- Group and lock elements to avoid accidental moves.
- Use align/distribute tools to solve spacing instantly.
- Create and reuse components (buttons, data cards, CTA blocks).
- Keep a ‘scratch’ artboard for experiments; copy successful elements into the main project.
These small habits add up to large time savings.
Make it look original - even when you start from a template
- Replace stock imagery with unique photos or tailored illustrations. Crop tight for stronger composition.
- Mix an illustration style with photography - add a monochrome mask or simple geometric frame to create cohesion.
- Customize icons - change stroke weight or color to match your brand.
- Rework negative space. Giving elements more room can instantly elevate appearance.
Creative constraint: limit yourself to three primary colors and two typography styles. Constraints breed identity.
Typography tips that read well (fast)
- Heading scale - 28–36–48 for web slides; adjust for project size.
- Line length - 50–75 characters for paragraphs.
- Use contrast - bold headings, regular bodies.
- Subheadings should be functional, not decorative.
For typographic fundamentals check resources like Google Fonts/typography principles and industry writeups.
Micro-animations and export: use motion with purpose
Animated elements add polish. Use micro-animations to direct attention, not distract.
- Animate only your primary CTA or key statistic.
- Keep animations subtle - fade, slide, or slight scale.
- Export GIFs for social, MP4 for video, PDF/PNG for print.
Visme supports simple animations and exports that fit most platforms. See Visme’s export guides for specifics: https://visme.co/help/
Collaboration and feedback loop
- Share view-only links for stakeholder feedback.
- Keep versioned copies (V1, V2…) so you can return to earlier concepts.
- Use comments to capture decisions and avoid endless email threads.
Collaboration features make iteration faster - but enforce a decision deadline to prevent scope creep.
A designer’s checklist before exporting
- Does the design have a single clear message?
- Is the type legible on the intended platform?
- Are the brand colors and fonts applied consistently?
- Do charts label the key figures?
- Have you optimized export settings for platform (RGB/PNG/JPEG/PDF/MP4)?
- Did you remove helper guides and hidden layers?
If you can confidently check these, you’re ready to export.
Quick inspiration recipes (mix-and-match)
- Bold stat card - big numeral + short context line + muted background + accent line.
- Comparison slide - two columns, mirrored icons, one highlight color per column.
- Story infographic - 6–8 sequential blocks, alternating image and text, numbered steps.
Use these recipes as building blocks; combine them like Lego.
Common pitfalls and how to avoid them
- Pitfall - Overdesigning - fix: strip the design to core message and rebuild only what’s necessary.
- Pitfall - Too many colors - fix: revert to your Brand Kit palette.
- Pitfall - Unreadable charts - fix: label the headline number and use clear axis labels.
Final mindset: structure enables creativity
Make speed your friend by establishing smart constraints and reusable components. Use templates to bypass mechanical work. Spend your time on storytelling: the unique angle, the core insight, the one figure people will remember.
Designers don’t get faster by rushing. They get faster by designing the process. Do that once, and every Visme project that follows will be both quicker and better.
Further reading and tools
- Visme - templates, charts, and tutorials: https://www.visme.co/
- Visme Help Center: https://visme.co/help/
- Gestalt principles (visual perception): https://en.wikipedia.org/wiki/Gestalt_psychology
- Color theory primer: https://www.smashingmagazine.com/2010/01/color-theory-for-designers-part-1-the-meaning-of-color/